
This is the second article in the series called Twitter Analytics. My goal is to see whether it is possible to discover meaningful social media insights by applying data analytics to the social network Twitter.
In this part, I want to talk about the score that I came up with to rate the performance of tweets and interpret its meaning.
Articles: Part 1 | Part 2 | Part 3
The attributes of a tweet
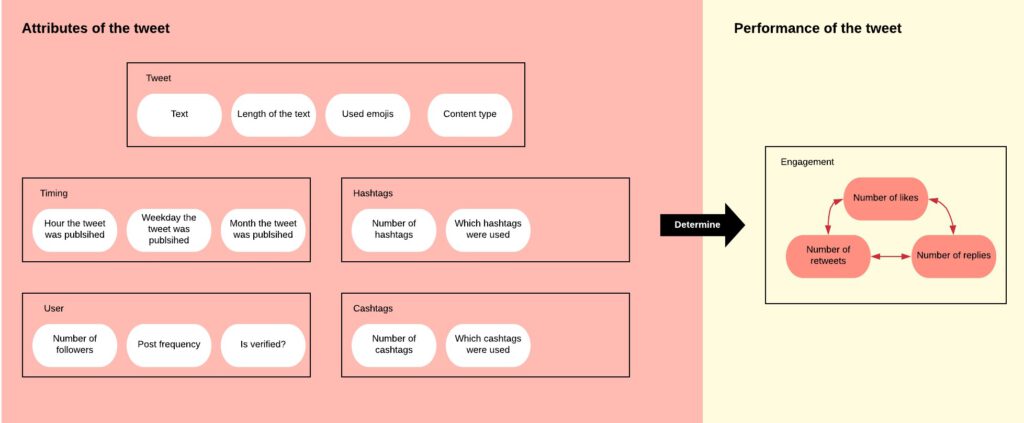
I utilized a tweet downloader to collect a comprehensive set of 17 data points per tweet, which can be classified into two distinct groups: attributes and performance metrics.
I declared a data point to be an attribute of a tweet if this data point is time-independent. This means the data point is set when crafting a tweet and then never changes throughout the lifetime of the tweet. Additionally, the attributes do not influence each other. For example, the hashtags of a tweet do not dictate when a tweet is posted, the text of the tweet does not influence how many followers a user has, etc.
Performance metrics are data points that change over time and have a strong correlation with one another. Likes, retweets, and replies are the three data points in this category that collectively represent a tweet’s overall performance. To determine the engagement score for each tweet, I assigned equal value to a single like, reply, and retweet, and then calculated the score as the total sum of those three.
EngagementScore = Number of Likes + Number of Replies + Number of RetweetsTesting the engagement metric
I tested the engagement metric with the attribute of tweet length. I first group the tweets by text length to get the distribution of text lengths in my population of tweets. In the second step, I then calculate the average engagement for each text length. This is the resulting graph:
First, we a look at the orange Amount of Tweets graph. This graph simply determines the length of every tweet (rounded by 10) and then counts how many tweets there are with a certain length to give an overview of the distribution of tweet length. Each of the tweet length categories has at least 646 tweets. When looking at the graph, it becomes apparent that a majority of the tweets utilized Twitter’s 280-character limit since we count 7420 tweets here. This prevalence can be attributed to individuals drafting longer tweets and subsequently condensing them to meet the limit. The second most frequently utilized tweet length was between 60 to 100 characters.
Let’s now examine the average engagement in more detail. To view the engagement score for each tweet length group, simply click on Amount of Tweets to hide the orange graph and reveal the blue graph by clicking on Average Engagement. The blue graph shows a negative correlation between engagement and tweet length, meaning that shorter tweets tend to perform better in this data set.
Interpreting the engagement metric
At this point, I must talk about causation as it is easy to read too much into the engagement score. Since this is only an observation and not a controlled experiment, it is not possible to prove that the tweet length caused the difference in engagement. The only information that we can infer from the graph is that the tweets with the highest engagement happened to have shorter lengths in this data set.
It could be that image posts are more popular and often only have a short caption as text. Or maybe popular influencers with high engagement rates lead a very busy lifestyle and therefore cannot be bothered to write more than 80 characters. Long story short – we do not know the real cause for the difference in engagement in this data set.
While we cannot establish causation, we were still able to make an interesting observation by seeing quite a clear correlation. I am therefore planning to experiment more with the engagement metric and check also the other attributes of a tweet for correlations. Although it does not provide causal insights such as X causing the Twitter algorithm to do X, we can still discover which attributes of a tweet have historically been linked to high engagement. By examining a variety of attributes, we can create a more comprehensive understanding of what correlates with high engagement. As a result, patterns emerge that reveal which tweets typically perform well in certain niches.