
This is the third article in the series called Twitter Analytics. My goal is to see whether it is possible to discover meaningful social media insights by applying data analytics to the social network Twitter.
In this part, I want to use the performance score that I created in the previous article and apply it to several attributes of a tweet to answer the question: “What attributes are related to a high tweet engagement?”
Articles: Part 1 | Part 2 | Part 3
Recap
In the previous articles, I covered the development of a tweet downloader and the categorization of tweet attributes. Additionally, I established a methodology to calculate an engagement score based on the combined metrics of likes, comments, and retweets for each tweet which can be used to uncover some interesting correlations.
In this article, I use the engagement score to find some more interesting relationships and correlations. The figures included in this article are interactive. You select and deselect graphs by clicking on the legends that are positioned in the top right corner. Furthermore, you can use controls like panning and zooming to take a closer look at the graphs. By hovering over a data point you can view its exact value.
The data set
The focus of the analysis is photography, and I have downloaded a comprehensive data set of 100,096 tweets containing the keyword “photography.” These tweets were collected over the past 130 days, which equates to approximately the last four months, from July 31st, 2020 to December 8th, 2020. I want to discuss how I prepared and filtered the data set before analyzing it.
You may be wondering why I filter tweets for a particular keyword. It might seem easier to analyze a random sample of tweets, but this approach yields inaccurate results. Twitter has a diverse user base with varying topics and niches, each behaving differently. Therefore, to obtain reliable insights into tweet performance, it’s necessary to use tweets from the same niche as a reference frame. This also helps to later check if the results seem plausible for the niche of photography.
Furthermore, I removed tweets with low engagement. Specifically, I filtered out all posts with no engagement by requiring each tweet to have at least one like, retweet, or reply since those tweets would not provide any valuable engagement data.
Additionally, I filtered out outliers. Outliers in the case of this data set were tweets that went “viral”. In most of the Twitter data sets I looked at when preparing this analysis, there is usually a very small part of tweets with incredibly high engagement that outperform all other tweets by a factor of 100, 1000, or even 10 000. Before filtering out those outliers, the sorted distribution of engagement looked like this.
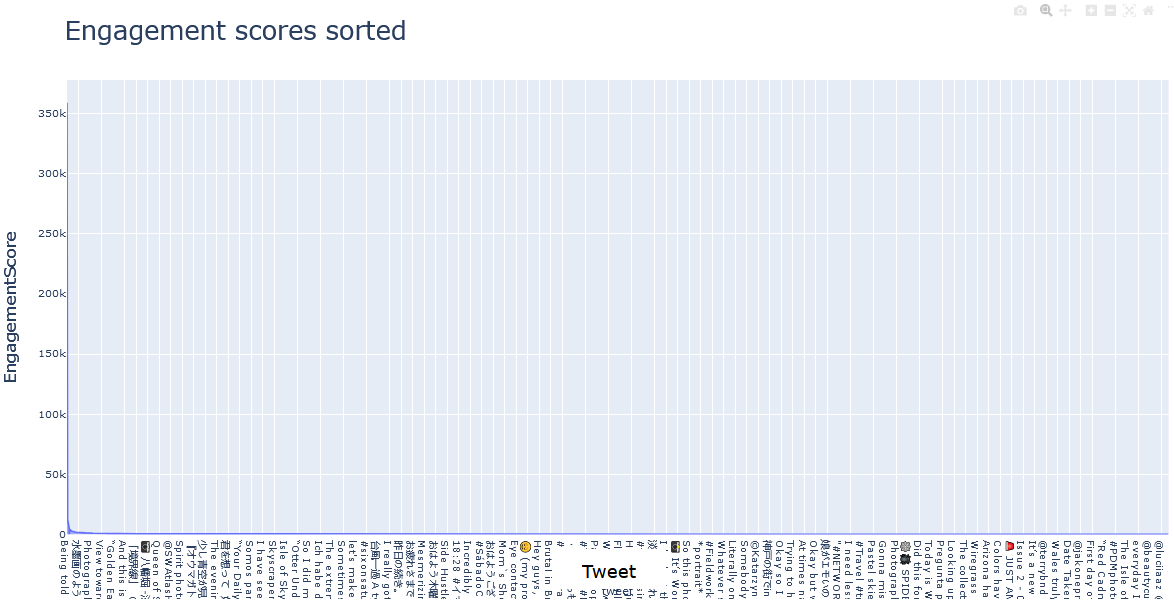
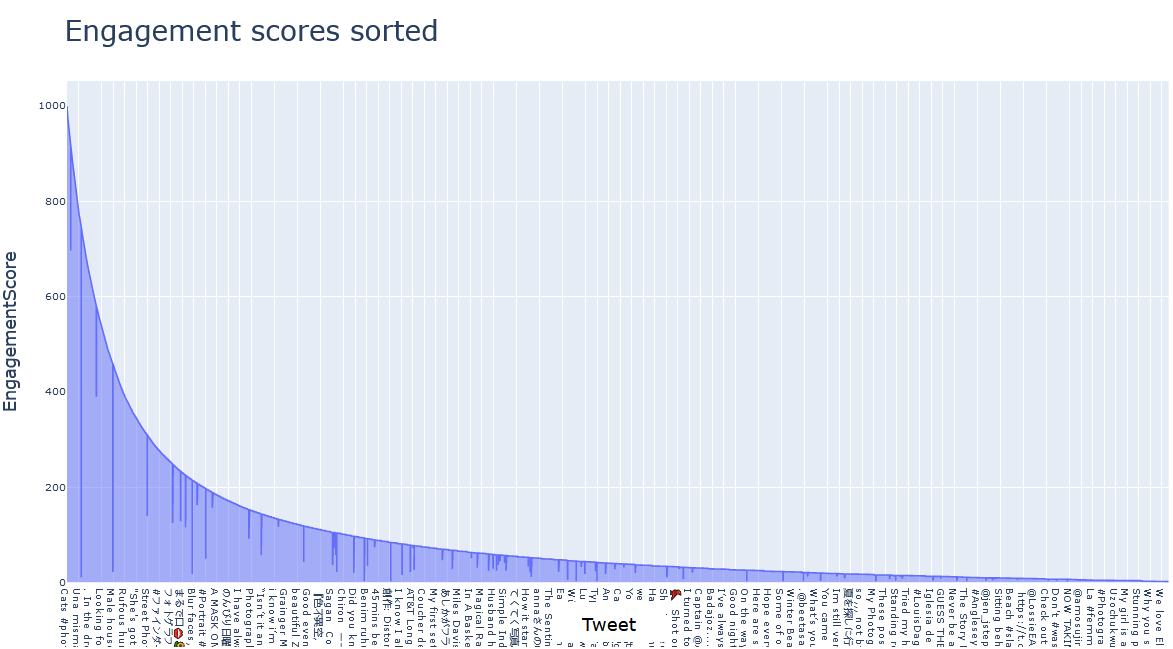
If you are wondering where the graph is, it is very close to the y-axis at first and then follows the x-axis to the right. The problem with this uneven distribution is, that a very small percentage of tweets gets the majority of the engagement. Therefore, the viral tweets will distort the correlations that we are plotting later. In order to remove this distortion, I chose a more evenly distributed subset of the data by filtering out all the tweets that got an engagement of over 1000. This was a good choice because the number of tweets in the data set shrank only by a little (from 100 096 to 97 771), while the distribution improved by a lot, as shown in the next picture.
Relationship between content and engagement
With regard to the content of the tweet, I want to check which content type and content length have a strong relationship to the engagement score.
The four types of tweets that Twitter differentiates are text, photo, link, and photo&link. A text tweet consists only of text, while a photo tweet has at least one photo. A link tweet contains a link to another website, although it is also frequently used to embed videos. A photo&link post includes photos and an external link or embed.
In the photography niche, tweets of the type photo generated the highest average engagement. Furthermore, photo&link received the second-highest average engagement, surpassing text and link tweets. This makes me believe that the most important thing for marketing your photography on Twitter is to directly include photos in your tweet. I’m thrilled with the results of this analysis since typically, tweets categorized as text got the most engagement in all the other data sets I tested. However, this particular data set focused on photography rewards photo tweets with the highest engagement on average, which is quite plausible.
If you want to check the fundamental distribution of how often the different tweet types occur, you can hide the Average Engagement graph by clicking on it in the legend and then clicking on the Number of Tweets graph to enable it. The orange graph displays the types of tweets that were posted in the photography niche over the past four months. The data shows that photos were the most prevalent tweet type, accounting for 68.47% of tweets. Text tweets were the second most frequently used, making up 16.66% of tweets. Link and photo&link tweets were infrequently used, accounting for only 14.87% of tweets combined.
When plotting the tweet length against the engagement score, a negative correlation emerges where longer tweets in the tweet in niche photography get less engagement. This learning goes hand in hand with the previous learning. My theory is that the shorter tweets are probably photo tweets that just provide a caption for the photo and the longer tweets are probably text tweets with more textual content. Therefore the notion that posting photos directly on Twitter without long texts lead to a high engagement also fits this observation.
The orange distribution graph shows us that most tweets in the dataset used up the 280 character limit of Twitter. That is pretty common because many people write tweets that are too long and then shorten them to get under the 280 character limit. The second most used tweet length is around 60 – 100 characters. The tweet lengths in between are not that popular. Since most of the tweets are photos, it makes sense that the length is shifted towards shorter tweets because most users probably only use the text as a short caption for their photo.
Relationship between posting time and engagement
With regard to the posting time of the tweet, I am examining the date on which the tweet was posted, the time of day when the post happened, and the day of the week.
Upon reviewing the blue engagement graph, it becomes apparent that the average engagement is consistent throughout the week, regardless of the day a tweet is posted. However, it is worth noting that a decline in average engagement begins around November 15th. Based on the data collected on December 9th, it can be inferred that newly published tweets after November 15th are still in the process of gaining engagement momentum. The graph suggests that it takes approximately a month for a tweet to reach its maximum engagement potential, after which engagement growth plateaus.
When looking at the orange graph, you can see that around 700 tweets about photography (that have at least 1 like, reply and retweet) get posted on Twitter every day. It also seems like the interest in photography increased in December because there are now 900 – 1000 tweets about photography being posted every day, which could be connected to the Christmas season. Overall the interest in photography seems pretty stable, with one big exception: the 19th of August. On the 19th of August, the number of tweets that were pubslihed increased to over 2100 tweets. The 19th of August is also known as World Photography Day, which explains the increase in photography tweets on that day.
Time of Day
The engagement data is pretty evenly distributed regarding the time of day. There does not seem to be a higher engagement when posting in the morning, the afternoon, or the evening. This makes sense since the data set contains global tweets so patterns like working time, breaks, and leisure time after work are evened out by the different timezones represented.
Day of the week
The day of the week also did not show an interesting pattern but the engagement was evenly distributed. There was no difference between posting on a Monday, Tuesday or any other day of the week.
Relationship between hashtags and engagement
Hashtags are a very important way to describe and categorize the contents of a tweet. To understand the relationship between hashtags and engagement, I look into the number of hashtags and the concrete hashtags that were used.
The relationship between engagement and the number of hashtags is not so clear as you can see in the blue graph. One could see an increase in engagement from zero to five hashtags, followed by a decrease from five to 14. However, the data points vary quite a lot so it’s hard to find a definitive relationship here.
In terms of the usage of hashtags, as shown in the orange graph, 33.18 % of the tweets in the data set did not contain a hashtag. The second most popular are one, two, three, four, or five hashtags with a 5% usage each (38.7 % in total). Starting with six hashtags, the number of tweets drops and steadily declines with an increasing number of hashtags.
The graph shows 125 hashtags that were used in the tweets present in the data set. For every hashtag, I calculated three metrics. Average Engagement (blue) shows how much engagement a tweet with that hashtag received on average. Number of Tweets (orange) shows how often a hashtag was used. And finally, the Number of Accounts using Hashtag shows how many different accounts used the hashtag in a tweet.
Let’s start by only looking at the orange graph. You can see the hashtags that were most used in the data set. The hashtags #nature, #photo, #naturephotography, #photooftheday were used most often. By zooming and hovering over the data points, you can get a feeling of the hashtags that were used most over the last three months in the photography niche.
The next thing you should look at is the green graph. It is very similar to the orange graph, but the values are smaller in total and there are smaller differences between the hashtags. This graph does not count how often a hashtag was used but how many different accounts used a hashtag. This is very important for filtering hashtags. Imagine Harry Styles (he currently has one of the highest engagements on Twitter) posts 100 selfies using #photography and #harrystyles. This would bias my analysis in a way that #harrystyles is shown as a very engaging hashtag for photography tweets when in reality it only makes sense to use it if you actually are Harry Styles. Therefore I defined that a hashtag has to be used by at least 100 different Twitter accounts to be ranked in this graph. If you zoom into the green graph, you will see that no data point drops under 100.
Finally, we can switch to the blue graph and find out which hashtag got the most engagement on average. The overall winner is #photos with an engagement of 335 on average. This hashtag is not as overused (1340 tweets in three months) as #nature (8697 tweets in three months) or #photo (6135 tweets in three months) but it is still broad enough to be displayed to many accounts. Also popular are #animals (with an engagement of 314 on average), #garden (with an engagement of 235 on average), and #night (with an engagement of 209 on average). Feel free to pan through the graph as it gives an interesting insight into which style of hashtags got a lot of engagement and it also shows which kind of photos were most engaged with.
Conclusion
Is it possible to discover meaningful social media insights by applying data analytics to the social network Twitter? Yes, definitely! Is it as easy as many articles and social media guides say? Of course not!
While getting actionable social media insights by analyzing data is possible, I think that it gets extremely oversimplified most of the time. I have seen a lot of articles that claim to know the perfect type of tweet to post, the perfect timing, or the perfect hashtags that work for every tweet. By analyzing different data sets I was able to learn that there are no global insights. The users, topics, interests, and behavior are so diverse that you simply cannot find any meaningful insights that fit all of them.
In order to find insights, you have to isolate the niche you want to look at in a smart way. I had to look through a lot of data sets before I found the right parameters to isolate the photography niche and establish a useful engagement distribution. Then you can get a feeling for what worked well historically, but again never causation. If I wanted to market my photos on Twitter, then I would conform to the format that this analysis outlines which is direct photo posts, short captions, and 4 or 5 of the hashtags that users engaged most with on average. This does not guarantee success, but on average it should improve and nudge my tweets in the direction of higher engagement compared to not complying with the format.
When you come across a social media insight that claims to work for everyone, it’s wise to approach it with a dose of skepticism. Instead, focus on the specific audience you’re trying to reach and delve into the unique details that drive engagement in that niche. By doing so, you’ll gain a better understanding of what truly works for your target market.